


By Jack Hoadley and Kennah Watts
More than five years ago, lawmakers enacted the bipartisan No Surprises Act (NSA), a law intended to protect privately insured patients from certain surprise medical bills and to help reduce system-wide health care costs. Since implementation, the NSA has successfully achieved one of two primary goals by protecting consumers from balance bills for covered services––as indicated by low complaint volumes, reductions in out-of-pocket spending, and other qualitative evidence.
However, the NSA’s second goal, to reduce premiums, has been severely undermined by stakeholder behavior and outcomes associated with the independent dispute resolution (IDR) process. Through various guardrails and a three-step process of initial payment, open negotiation, and then final-offer arbitration (intended to serve a last resort and anchor around in-network rates), the IDR process was designed to encourage fair payment and to resolve disputes between payers on one side of the dispute and out-of-network providers and facilities (collectively referred to as providers) on the other. (In final-offer arbitration, also known as baseball style arbitration, each party proposes a payment amount and the arbitrator selects one of the proposed amounts, with no ability to “split the difference” by awarding an amount between the two proposals.)
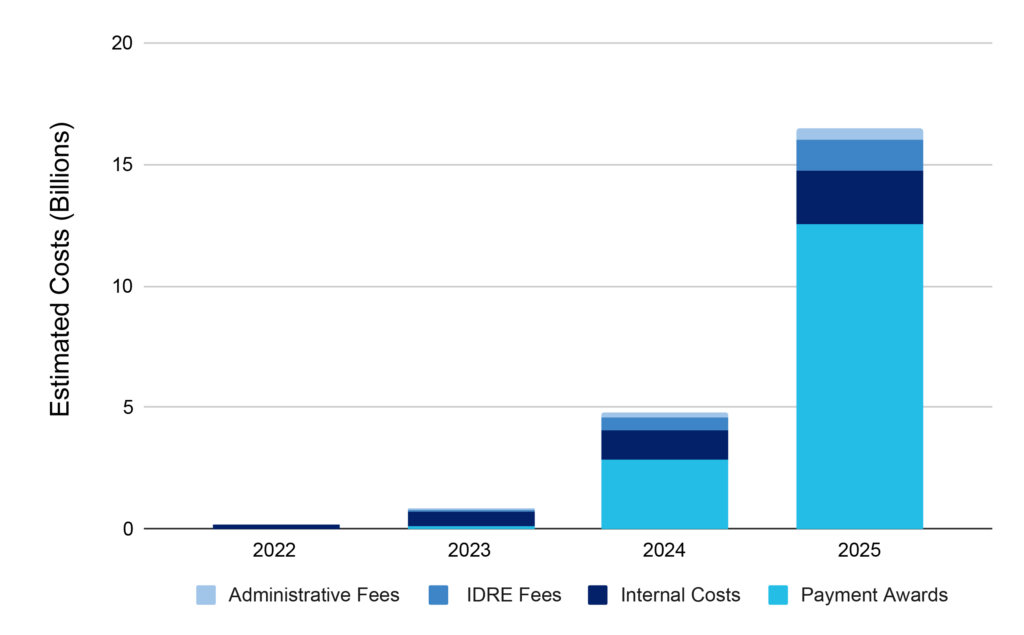
As discussed below, public use file (PUF) data show that the IDR system has resulted in total costs of $22.4 billion from 2022 to 2025. This includes $15.6 billion in payment amounts awarded by IDR entities that exceed in-network rates; $4.2 billion in internal administrative costs; and $2.7 billion in IDR administrative and entity fees. This estimate dramatically exceeds our previous estimate of $5 billion in total costs for 2022 through 2024. In 2025 alone, total IDR costs were $16.6 billion, an amount nearly 3.5 times higher than for 2024 alone.
These escalating costs are driven by the sheer volume of disputes (which rose by 77 percent from 2024 to 2025) and higher payment amounts (which rose by 264 percent from 2024 to 2025). Similar to our prior analysis, the IDR process is dominated by a handful of provider organizations, many of which are backed by private equity or have other conflicted profit interests. Providers also continue to overwhelmingly prevail in the IDR process, winning about 85 percent of all IDR disputes in 2025 with a median award of more than four times the qualifying payment amount (QPA), which is defined as the median contracted in-network rate for care.
This article summarizes the most recent PUF data, provides an update to our previous estimate of the total costs attributable to IDR, and discusses considerations for policymakers who may want to revisit the NSA to ensure that the law meets its cost containment goals without jeopardizing consumer protections.
Over Four Years, The IDR System Has Incurred $22 Billion In Total Costs
Over the first four years (2022 to 2025), total costs attributable to the IDR system totaled $22.4 billion (including air ambulance disputes) (Exhibit 1). This estimate dramatically exceeds our previous estimate of $5 billion for 2022 through 2024. In 2025 (the most recent data available), total IDR costs were $16.6 billion, an amount nearly 3.5 times higher than 2024 alone.
Exhibit 1. Total estimated costs of the IDR process, 2022 to 2025*
Source: Authors’ analysis of Federal IDR Supplemental Tables and Public Use Files (2023-2025)
*Includes air ambulance disputes.
Our estimate of the $22.4 billion in costs attributable to IDR is designed to reflect costs that would not be incurred if providers accepted the initial plan payments. In the last two quarters of 2025, the median initial payment amounts were about 90 percent of the QPA. According to data from the health plan industry, about 76 percent of initial payments by plans are accepted by providers and never proceed to IDR. There may also be some claims where open negotiations lead to an amount above the initial payment amount (estimated by the plan survey as 18 percent). Thus, 6 percent of NSA-eligible claims are estimated to go to IDR, (although PUF data cannot verify this), representing a small, but costly proportion of claims.
Components of IDR System Costs
We built our cost estimate from three main components: the payment determination amounts that exceed in-network rates (as measured by the QPA), the internal administrative expenses incurred by the participating parties, and the fees that parties pay when using the IDR system. Our approach is detailed here.
Payment Amounts
The largest component of total costs comes from the payment amounts determined by the IDR entities to be owed to the provider, to the extent that these amounts exceed the QPA. We calculate this by subtracting the total dollar amount of all payment determination awards from the total dollar amount of the QPA for the disputed services. From 2023 to 2025, this equated to $15.6 billion (data unavailable for 2022). Both the initial payment amount paid by the plan to the out-of-network provider and the amount the plan offers in IDR hew closely to the QPA, so we assert that amounts awarded above the QPA are attributable to the use of IDR.
Some stakeholders, namely provider organizations, have criticized the QPA as an underestimate of the actual in-network rate or an underestimate of the market price for out-of-network services. To reflect this argument, we also estimated total costs for 2025 at two different multiples of the QPA. If payment determinations amounts were 150 percent or 200 percent of the QPA, our cost estimate of $16.5 billion in total costs for 2025 would be reduced by about $1.1 billion and by about $2.3 billion, respectively.
The total awards alone, without subtracting QPA, equate to $19.3 billion.
Internal Administrative Costs To The Parties
The parties engaged in IDR disputes also incur internal administrative costs. There is no direct source for measuring these costs, so we calculated them using estimates by the Departments of Health and Human Services, Labor, and the Treasury (Departments) in an impact analysis accompanying the interim final rule that set up the IDR system. The Departments estimated that plans’ and providers’ internal costs to submit various IDR materials would be $857 per dispute. Multiplying that by the total disputes initiated from 2022 to 2025 yields $4.2 billion in internal administrative costs.
It is important to note that this amount only accounts for the mechanical aspects of submitting and monitoring IDR disputes, as estimated by the Departments. This estimate does not include the administrative costs that stakeholders incur for managing their IDR participation, costs incurred by or paid to third-party middlemen organizations to file disputes, or costs associated with the hundreds, if not thousands, of lawsuits (several of which are highlighted here) that have been filed over the IDR process since the system was initiated. This analysis also does not reflect any costs a third-party administrator or insurer may charge to employers to engage in the IDR process on their behalf.
Fees For The IDR Process
Two types of fees were established by the NSA for operating the IDR system. First, administrative fees are charged to all parties for each dispute and are used by the federal government to administer the system. From 2022 to 2025, these fees totaled $742 million. For disputes initiated after June 3, 2026, the fee amount is $15, reduced from $115 in the recent IDR operations rule. Second, the losing party in a dispute pays an IDR entity fee. These fee amounts are set every year by each IDR entity and maintained by the IDR entity to fund its operations. In 2026, the fee ranges from $425 to $800 for single disputes and as high as $1,125 for batched disputes of up to 25 items. Total IDR entity fees paid from 2023 to 2025 were $1.9 billion (data not available for 2022).
Data Limitations
Furthermore, we do not attempt to estimate any costs added or saved by differential plan payments compared to those made before passage of the NSA. As such, this is not an estimate of the overall cost impact of the NSA, which would reflect any potential impact on network rate negotiations and other broader effects. We also cannot account for any potential financial gains or other incentives that insurers or third-party administrators might have due to, for instance, shared savings schemes.
IDR Costs Are Primarily Driven By Dispute Volume And Payment Awards
Both dispute volume and the typical size of the awards made by IDR entities have experienced massive year-to-year increases, and they are the major forces driving the rapidly growing cost of the IDR system. While dispute volume was up 77 percent from 2024 to 2025, total awards rose by 264 percent, more than triple the volume growth. The gap between these rates, as well as the rapid growth in the large awards in the 90th percentile of disputes, points to the influence of more disputes with unusually high-dollar awards. Many of these disputes are filed by surgeons, assistant surgeons, and neurologists—none of whom were the primary targets of surprise billing protections.
The evidence presented here suggests that providers have a clear incentive to keep filing disputes and to ask for higher and higher amounts. To date, there is no evidence that there is any ceiling on the amount requested by providers that are deemed by IDR entities to be the superior offer.
IDR Volume Continues To Climb And Exceed Agency Estimates
As noted above, the volume of disputes has been steadily rising. In 2025, providers initiated 2.6 million new disputes, up 77 percent from 2024. This volume is astronomical in comparison to the Departments’ original estimate of approximately 22,000 disputes a year (including air ambulance disputes). The dispute volume has quickly risen in the most recent eight quarters, including a jump in the first six months of 2026 to 1.75 million disputes, 50 percent above the same period of 2025 (as documented in recent bi-monthly reports).
As we have reported previously, disputes are disproportionately filed by a subset of providers. The largest filers of disputes are large physician organizations, many of which are backed by private equity, and middleman organizations that file disputes for providers. In 2025, over three-fourths of resolved dispute lines—which is how PUF data are presented and account for services filed in batches—came from the following three organizations:
- Radiology Partners (30 percent), a large national radiology practice group with private-equity backing;
- HaloMD (27 percent), a middleman organization that files disputes on behalf of providers; and
- TeamHealth (20 percent), a multispecialty provider group with private-equity backing (Exhibit 2).
Exhibit 2. Number of resolved dispute lines* by filing organization, 2023 to 2025

Source: Authors’ analysis of Federal IDR Public Use Files (2023-2025)
*The PUF presents data in terms of dispute line-items, to account for services filed in batch. To reflect the total number of services filed by provider organizations, we present this volume in terms of dispute lines, rather than disputes.
Not all disputes are filed directly by provider organizations. As noted above, over one-quarter of dispute lines in 2025 were filed by HaloMD. Organizations such as HaloMD market their ability to maximize IDR awards, and HaloMD boasted of winning $2 billion in award determinations for provider clients, along with a 90-percent win rate and a median award more than eight times the QPA. This organization has been accused in lawsuits—unsuccessfully to date—of gaming the IDR system. Recent reporting by STAT also indicates that HaloMD employees are allegedly instructed to move quickly through IDR submissions without verification of required steps.
Although HaloMD is the largest such middleman organization filing IDR disputes, there are others, such as Zotec Partners. It is difficult, however, to identify the scale of involvement by middlemen organizations because disputes can be filed under their clients’ names, making it impossible to identify these entities in the PUFs. As best we can tell from the data, many smaller local practices are not using the IDR process, whether under their own name or through middlemen, even though these providers may also be concerned about allegedly insufficient payments by payers.
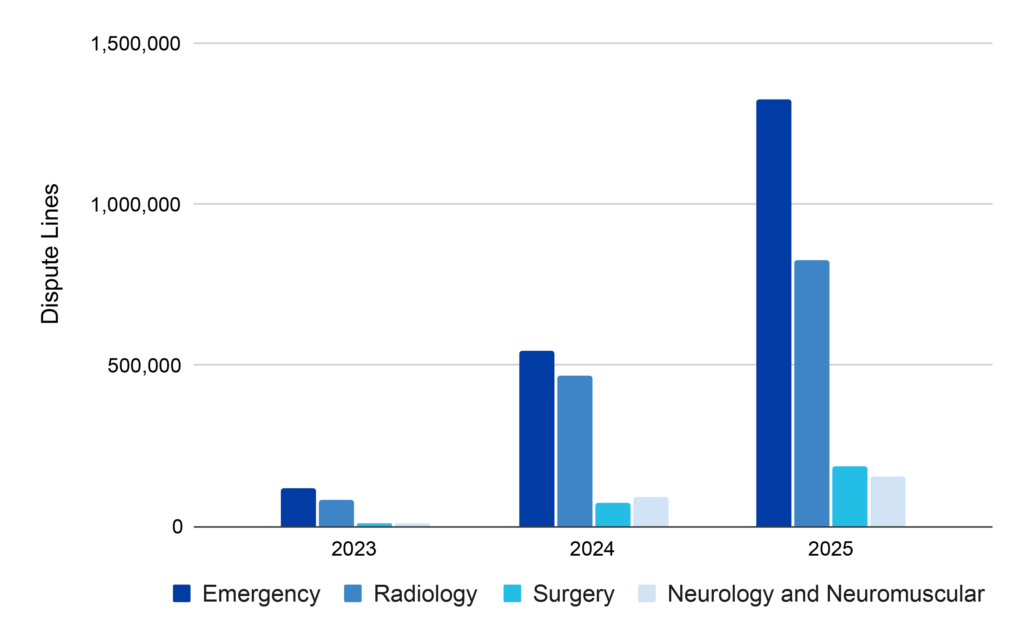
Similarly, certain provider specialties initiate the vast majority of IDR disputes. From 2023 to 2025, emergency medicine and radiology accounted for the majority of dispute lines: 41 percent and 29 percent of all dispute lines, respectively. While their share of total claims has remained steady over the years, their total volume of disputes has increased substantially (Exhibit 3). The ever-increasing number of disputes among these specialties is indicative of greater IDR uptake in general, which could be driven by more providers moving out-of-network, providers using IDR as a more routine means for payment, or some combination of both incentives. In 2025, there was also a substantial uptick in the share of disputes filed by facilities—such as hospitals, independent emergency departments, and air ambulance companies—rather than individual physicians or physician organizations. The proportion of claims filed by facilities rose from 12 percent in the first quarter of 2023 to 24 percent in the fourth quarter of 2025.
Exhibit 3. Number of resolved dispute lines by provider specialty, 2023 to 2025
Source: Authors’ analysis of Federal IDR Public Use Files (2023-2025)
Providers Continue To Prevail Overwhelmingly In IDR
In 2025, providers prevailed in approximately 85 percent of all disputes, similar to previous years but down slightly from 88 percent in the second quarter of 2025 (the peak win rate to date). Of the five provider groups with the most disputes, four had a win rate above 90 percent: Radiology Partners (96 percent), Team Health (95 percent), SCP Health (92 percent), and AGS Health (91 percent).
As we’ve previously written, IDR entities are paid on a per-dispute basis––and are not paid for ineligible disputes––and thus have a financial incentive to deem disputes eligible and rule in favor of providers to drive further volume. Prior to the most recent PUF release, the IDR entities were not identified in resolved disputes. However, the PUFs for the third and fourth quarters of 2025 explicitly identify IDR entities, alongside other dispute-level information. The data show that IDR entities vary significantly in provider win rates and award amounts.
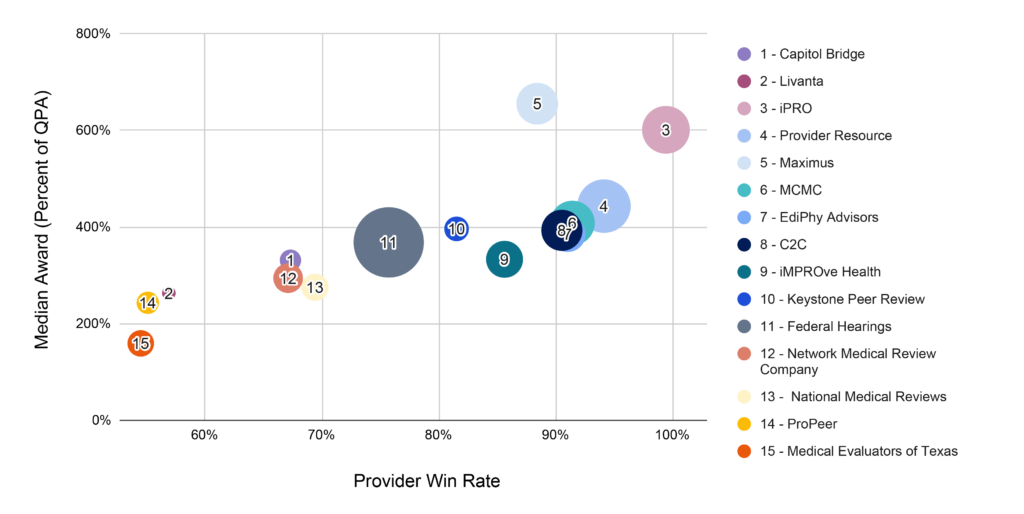
Furthermore, IDR entities that more often rule in favor of providers are correlated with higher award amounts. This may indicate that providers requesting higher payment amounts tend to select IDR entities that most frequently rule in their favor (Exhibit 4). For example, in the fourth quarter of 2025, Island Peer Review Organization (iPRO) ruled in favor of providers in 99.4 percent of arbitrated disputes. In these disputes, iPRO granted a median award of 601 percent of QPA, well above the median for all disputes. Conversely, Medical Evaluators of Texas ruled in favor of providers in only half (54.5 percent) of their arbitrated disputes, with a much lower median award of 159 percent of QPA, the lowest among all IDR entities (Exhibit 4).
Exhibit 4. Provider win rate, median award, and volume* by IDR entity, Q4 2025
Source: Authors’ analysis of Federal IDR Public Use Files (Q2 2025)
*Note that the size of the circle is proportional to the IDR entity’s volume of dispute lines arbitrated.
The data also show that the IDR entities with the highest win and award levels are assigned the largest volume of cases (Exhibit 4). This may reflect the rules that allow providers the initial choice of IDR entity, providing early evidence that the volume-profit incentives discussed above might be at play: IDR entities that rule for providers more often, particularly when large amounts are requested, are more likely to be chosen by providers and thus likely—under a system that pays per eligible dispute—to be more profitable than their less-frequently chosen competitors.
The rationale behind IDR entities’ determinations remains unclear. Some IDR entities claim that awards above QPA are not “evidence of arbitrator bias or process failure” and instead “reflect procedural defaults, incomplete submissions, or failures to provide information necessary for review.” But, without transparency into the dispute submission process or IDR entities’ payment determination process, outsiders can only speculate as to why these differences arise.
Provider Award Amounts Have Steadily Increased And Raise Cost Concerns
As indicated above, provider awards have grown even more rapidly than the volume of disputes. When providers prevailed in 2025, they won a median award of 445 percent of QPA. While this award amount is consistent with the median award for 2024 (447 percent of QPA), there was a substantial increase in outlier disputes. In 2025, the 90th percentile of awards were 1,771 percent of QPA, a jump from 1,226 percent of QPA in 2024. This means that a subset of providers asked for especially high amounts in the top 10 percent of disputes, at least 17 times the QPA. As with previous years, when plans prevailed, their wins continued to hold at QPA, with a median prevailing plan award of 105 percent of QPA in 2025.
For several of the specialties with the most disputes, providers’ median prevailing amount was significantly higher in 2025 compared to 2024. For example, in 2025, emergency services had a median award of 315 percent of QPA, up more than 30 percentage points from 2024 (280 percent QPA). For specialties with the highest award amounts, these annual increases were more dramatic: From 2023 to 2025, the median awards for neurology and plastic surgery more than doubled; in 2025, median awards for these specialties ranged from 24 to 30 times QPA (Exhibit 5). For some services, such as breast reductions, these median awards as of 2025 were more than 80 times Medicare rates and represented $62.7 million in total awards.
Exhibit 5. Median prevailing provider award as percent of QPA by specialty, 2023 to 2025
| Specialty | 2023 | 2024 | 2025 |
|---|---|---|---|
| Emergency Department Services | 235% | 280% | 315% |
| Radiology | 409% | 559% | 468% |
| Pathology and Laboratory | 100% | 342% | 416% |
| Anesthesia | 199% | 247% | 315% |
| Neurology and Neuromuscular Procedures | 974% | 1,464% | 2,450% |
| Surgery | 712% | 1,009% | 1,355% |
| Plastic Surgery: Breast Implant and Reconstruction* | 1,495% | 2,468% | 3,239% |
Source: Authors’ analysis of Federal IDR Public Use Files (2023-2025)
*Plastic surgery is a subset of surgery.
These wins represent billions of dollars in awards. From 2023 to 2025, the total awards for surgery services equated to $3.8 billion (Exhibit 6). This is especially notable given the small share of disputes (5 percent) attributable to surgery. Similarly, neurology and neuromuscular services accounted for 5 percent of disputes but totaled $2.02 billion in awards. By contrast, radiology had more disputes (approximately 23 percent), but the awards totaled $1.03 billion. Though the volume of surgery and neurology disputes was relatively small, the dollar amounts attributable to these disputes continued to drive overall IDR costs. A similar point is made in a recent analysis by the Niskanen Center. (Volume in this paragraph reflects dispute lines in the QPA tab of the PUF).
Exhibit 6. Total awards by specialty, 2023 to 2025

Source: Authors’ analysis of Federal IDR Public Use Files (Q2 2025)
Despite High Volume, The IDR Backlog Has Decreased And Ineligibility Rates Remain Consistent
Long waits to get disputes resolved have been source of frustration and a factor in adding to system costs from the program’s start. But, even with ever-increasing dispute volume, it appears the Departments and the IDR entities have learned to process disputes more quickly. In 2025, IDR entities resolved about 2.7 million disputes, double the number closed in 2024. Furthermore, as of the end of 2025, 98 percent of all IDR disputes submitted have either been resolved or were less than 30 business days old, which is the statutory deadline. The vast majority of disputes (92 percent) initiated since the system began in 2022 have been resolved. This is largely because IDR entities are resolving disputes more quickly: In the fourth quarter of 2025, the median time to determination was 25 days, down from the peak of 96 days in the third quarter of 2024.
The share of ineligible disputes has remained consistent: Payers challenged eligibility in 41 percent of disputes in 2025, and IDR entities ruled 18 percent of disputes ineligible. The presence of so many ineligible disputes is yet another factor adding to system costs without outcomes that help any of the participants. (Payers are burdened by having to review and respond to disputes that are ultimately deemed ineligible, although they are of course better off with a dispute ruled ineligible than had that dispute been allowed to move through the process.) In the supplemental background on the most recent PUF release for 2025, the Departments reported the most common reasons for ineligibility were due to violations of the 90-calendar-day cooling-off period or disputes falling under state jurisdiction. No detailed data are publicly available on the reasons for dispute ineligibility.
Runaway IDR Costs Begin To Affect Premiums
These marked and fast-growing trends suggest that the NSA is adding to, rather than reducing, health care costs. While the NSA protects consumers who receive out-of-network care from surprise medical bills, ever-increasing IDR costs will likely lead to cost increases for consumers in other ways. In the short term, higher plan spending on IDR may lead plans to offset spending with higher premiums. In the longer term, if providers continue to obtain high IDR awards, employers and plans may take other steps to try to reduce health care costs, including further raising premiums, increasing patient cost sharing, narrowing provider networks, and restricting wage increases.
At the same time, providers could try to leverage IDR success in obtaining higher payments in one of two ways. Some providers may prefer to stay out of network and use IDR to get higher out-of-network payments. Other providers may leverage the threat to leave the network and use IDR to get higher negotiated rates for in-network services. Both strategies have the potential to push plan spending and premiums upward.
While there is little comprehensive evidence on how the IDR process is affecting plan premiums, employers and insurers have begun raising this concern in advocacy materials, amicus briefs, and earnings calls. For instance, the New York Department of Civil Service reported that it has incurred more than $200 million in additional claim payments from IDR for the state employee health plan, which the agency described as “a primary contributor to the nearly 10 percent increase in premium rates [in 2025].” The United Service Workers union plan reported that it raised premiums by an additional 1.75 percentage points to offset IDR awards and fees. And a United Healthcare official noted that “the IDR process is driving a 2 to 6 percent incremental increase in total premium expenses” for their commercial business.
These premium hikes allegedly stem both from high award amounts as well as internal administrative costs, such as those noted above. In fact, one mid-size health plan reported having “well over 400 people just working IDR disputes. That’s significant. Those salaries, the cost of that all has to be paid somewhere, and it comes out in premiums.” While it is unclear to what extent these costs are incurred by the insurer or passed on to the employer, it seems highly likely that the costs are already being felt by plan members.
Looking Forward
The NSA’s IDR process was expected to lead to balanced outcomes. The requirement for open negotiations before IDR can be initiated, the loser-pays requirement for IDR entity fees, and the use of final-offer (baseball-style) arbitration were all included as incentives for compromise. Given this assumption of balanced outcomes anchored around in-network rates (as represented by the QPA), the Congressional Budget Office (CBO) expected IDR to put downward pressure on both in- and out-of-network payment rates. Consequently, CBO estimated up to 1 percent reductions in premiums and federal savings of $17 billion over ten years.
But the trends in IDR dispute volume, the magnitude of IDR awards, and the resulting IDR costs far exceed anyone’s expectations from when the NSA became law. All stakeholders—providers, plans, and the IDR entities—have complex incentives with regard to how they use the system. There is little evidence of compromise or shift of offers toward the center in over three years of arbitration, and several observers have pointed out the failure of final-offer arbitration in the IDR process. Ever escalating costs have led to renewed attention from parties ranging from the CBO to the Trump administration to the editorial board of The Wall Street Journal.
As CBO recently acknowledged, “Emerging evidence suggests that the law might not have the effects [initially] anticipated.” To inform analysis of the NSA’s real-world effects, more research is needed to understand IDR outcomes, IDR entity decision-making processes and determinations, and the law’s longer-term effects on network participation, prices, and ownership structure. It also remains to be seen whether and how the changes made under the Trump administration’s recently finalized IDR operations rule will affect the incentives discussed above, especially with respect to dispute eligibility and volume.
Even as this research continues, the time may be ripe to revisit the NSA to realize the law’s original cost-containment goals without jeopardizing consumer protections. Policymakers could, for instance, replace IDR with a payment standard to regulate what plans must pay out-of-network providers in NSA-eligible disputes. A payment standard was considered, although ultimately not adopted, in the debate leading up to the NSA; this approach scored greater savings and premium reductions from CBO.
Another option would be for Congress to change how IDR entities balance the various factors considered in arbitration or to modify the factors altogether. Congress could, for instance, make even clearer that the QPA should be the primary or first factor that IDR entities consider during arbitration; limit the use of prior contracted rates to a certain period of time; cap the amount that can be obtained through IDR; or allow external data sources (e.g., transparency in coverage data) to be considered during arbitration. Congress could also modify the methodology for calculating the QPA, which has been criticized by providers as inaccurate and an underestimate of the true market rate for care, or replace the QPA with an entirely different measure of the commercial in-network rate.
Congress could also make operational changes to the IDR process to try to mitigate the concerns raised above. For instance, Congress could impose penalties on stakeholders that file a large number of ineligible disputes or that fail to pay IDR awards in a timely manner. The latter policy was included in a bill introduced by Representative Gregory Murphy (R-NC). Congress could also require additional oversight or auditing of IDR decision-making and other processes.
While we have identified a range of options to build on and improve the NSA, policymakers may want to prioritize policies that more directly reduce the high costs of the IDR system by reforming the incentives that have resulted in high volume and high payment determinations. These incentives and the resulting costs are undermining the NSA’s goal of cost containment and will likely contribute to higher costs for consumers and employers in the midst of a health care affordability crisis.
Authors’ Note
The work described in this article was funded by Arnold Ventures. The authors thank Zeynep Çelik and Katie Keith for their contributions to this paper.
Jack Hoadley and Kennah Watts “Spending On IDR Process Pushes No Surprises Act Costs To More Than $22.4 Billion Over Just Four Years” August 26, 2026, https://www.healthaffairs.org/content/forefront/spending-idr-process-pushes-no-surprises-act-costs-more-than-22-4-billion-over-just. Copyright © 2026 Health Affairs by Project HOPE – The People-to-People Health Foundation, Inc.

